


Our platform monitors 100+ GW of assets with a collective portfolio of 44,000+ wind turbines, across 4,400+ farms in 65 countries, to provide benchmark insights that matter the most.
Compare key performance indicators
Get targeted insights to zero in on issues
Deliver targeted performance improvements
Measure O&M team performance
The Utopus differentiator - Benchmark From Day 1
Maximizing return on investment of renewable assets is a key driver for any asset owner. Are my assets performing to their highest potential, and are revenues the highest they could be? Organizations typically track business performance using their own KPIs. But what’s even more powerful? Having accurate visibility to peer performance informs you where you can improve, or how well you are already doing against a global benchmark view you simply cannot get on your own.
With access to 100+GW of data in our proprietary Scipher™ data analytics platform from wind turbines worldwide, Utopus Insights now offers as part of our performance monitoring and visualization software, Scipher.Vx+, a powerful new feature that allows you to automatically benchmark and rank your assets against the best, worst and industry average farms against a worldwide sample of wind assets. Right from Day 1 of onboarding, track where your asset performance stacks against the best, and the rest.
Reliable Data
Taps into industry best asset data with high reliability index to provide valuable insights.
Improvement Opportunities
From CEO to performance engineers, get insights on assets not previously accessible.
Smart Operations
Proactive, continuous tracking and improvement of asset performance based on benchmarking data.
Baselining and Benchmarking with Big Data: Unearth millions in revenue generation potential from your wind assets
Feng Zhang, Product Director, talks about the need for Operational Excellence Benchmarking and the new way of doing business in the wind industry. The Operational Excellence Benchmarking module of Scipher.Vx+ provides CXOs and Operations Heads access to global asset benchmarking reports to compare performance relative to a vast sample of turbine performance data.
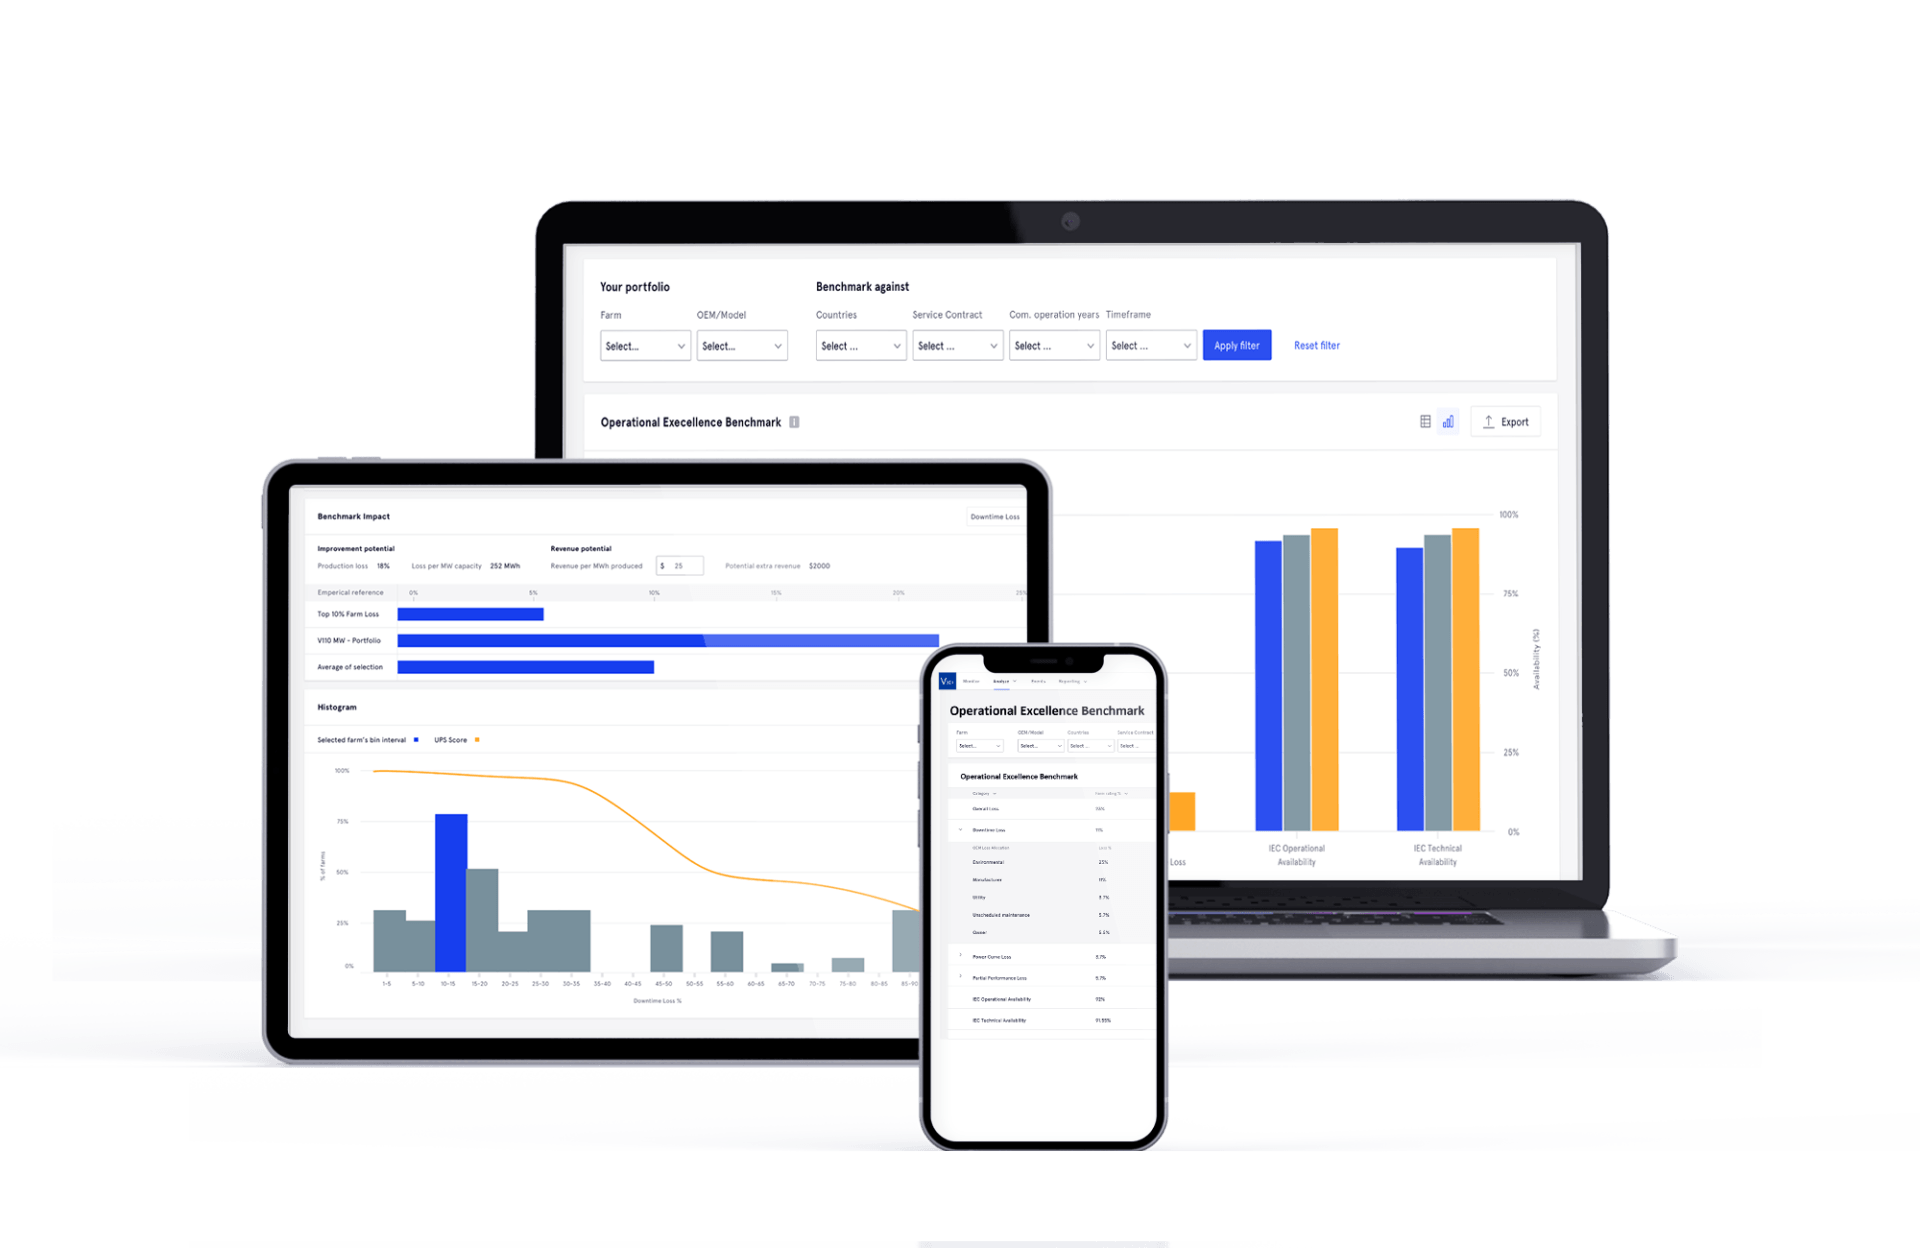

Streamlining O&M activities with powerful insights
Using historical SCADA data and in-depth wind turbine domain knowledge, Scipher.Vx+ cleanses, analyzes, categorizes and generates tabulated data across every detail of loss categories including power curve loss, downtime loss, and partial performance loss to benchmark against global asset data.
ScipherScore
Lorem Ipsum Lorem Ipsum Lorem Ipsum Lorem Ipsum Lorem Ipsum Lorem Ipsum Lorem Ipsum Lorem Ipsum Lorem Ipsum Lorem Ipsum Lorem Ipsum Lorem Ipsum Lorem Ipsum Lorem Ipsum Lorem Ipsum Lorem Ipsum Lorem Ipsum Lorem Ipsum Lorem Ipsum Lorem Ipsum Lorem Ipsum Lorem Ipsum Lorem Ipsum Lorem Ipsum Lorem

Making it Actionable
